Welcome to pyGenomeTracks’s documentation!
Standalone program and library to plot beautiful genome browser tracks
pyGenomeTracks aims to produce high-quality genome browser tracks that are highly customizable. Currently, it is possible to plot:
bigwig
bed/gtf (many options)
bedgraph
bedgraph matrices (like TAD-separation scores)
epilogos
narrow peaks
links (represented as arcs, triangles or squares)
Hi-C matrices (as triangle or squares)
fasta
maf (multiple alignment format)
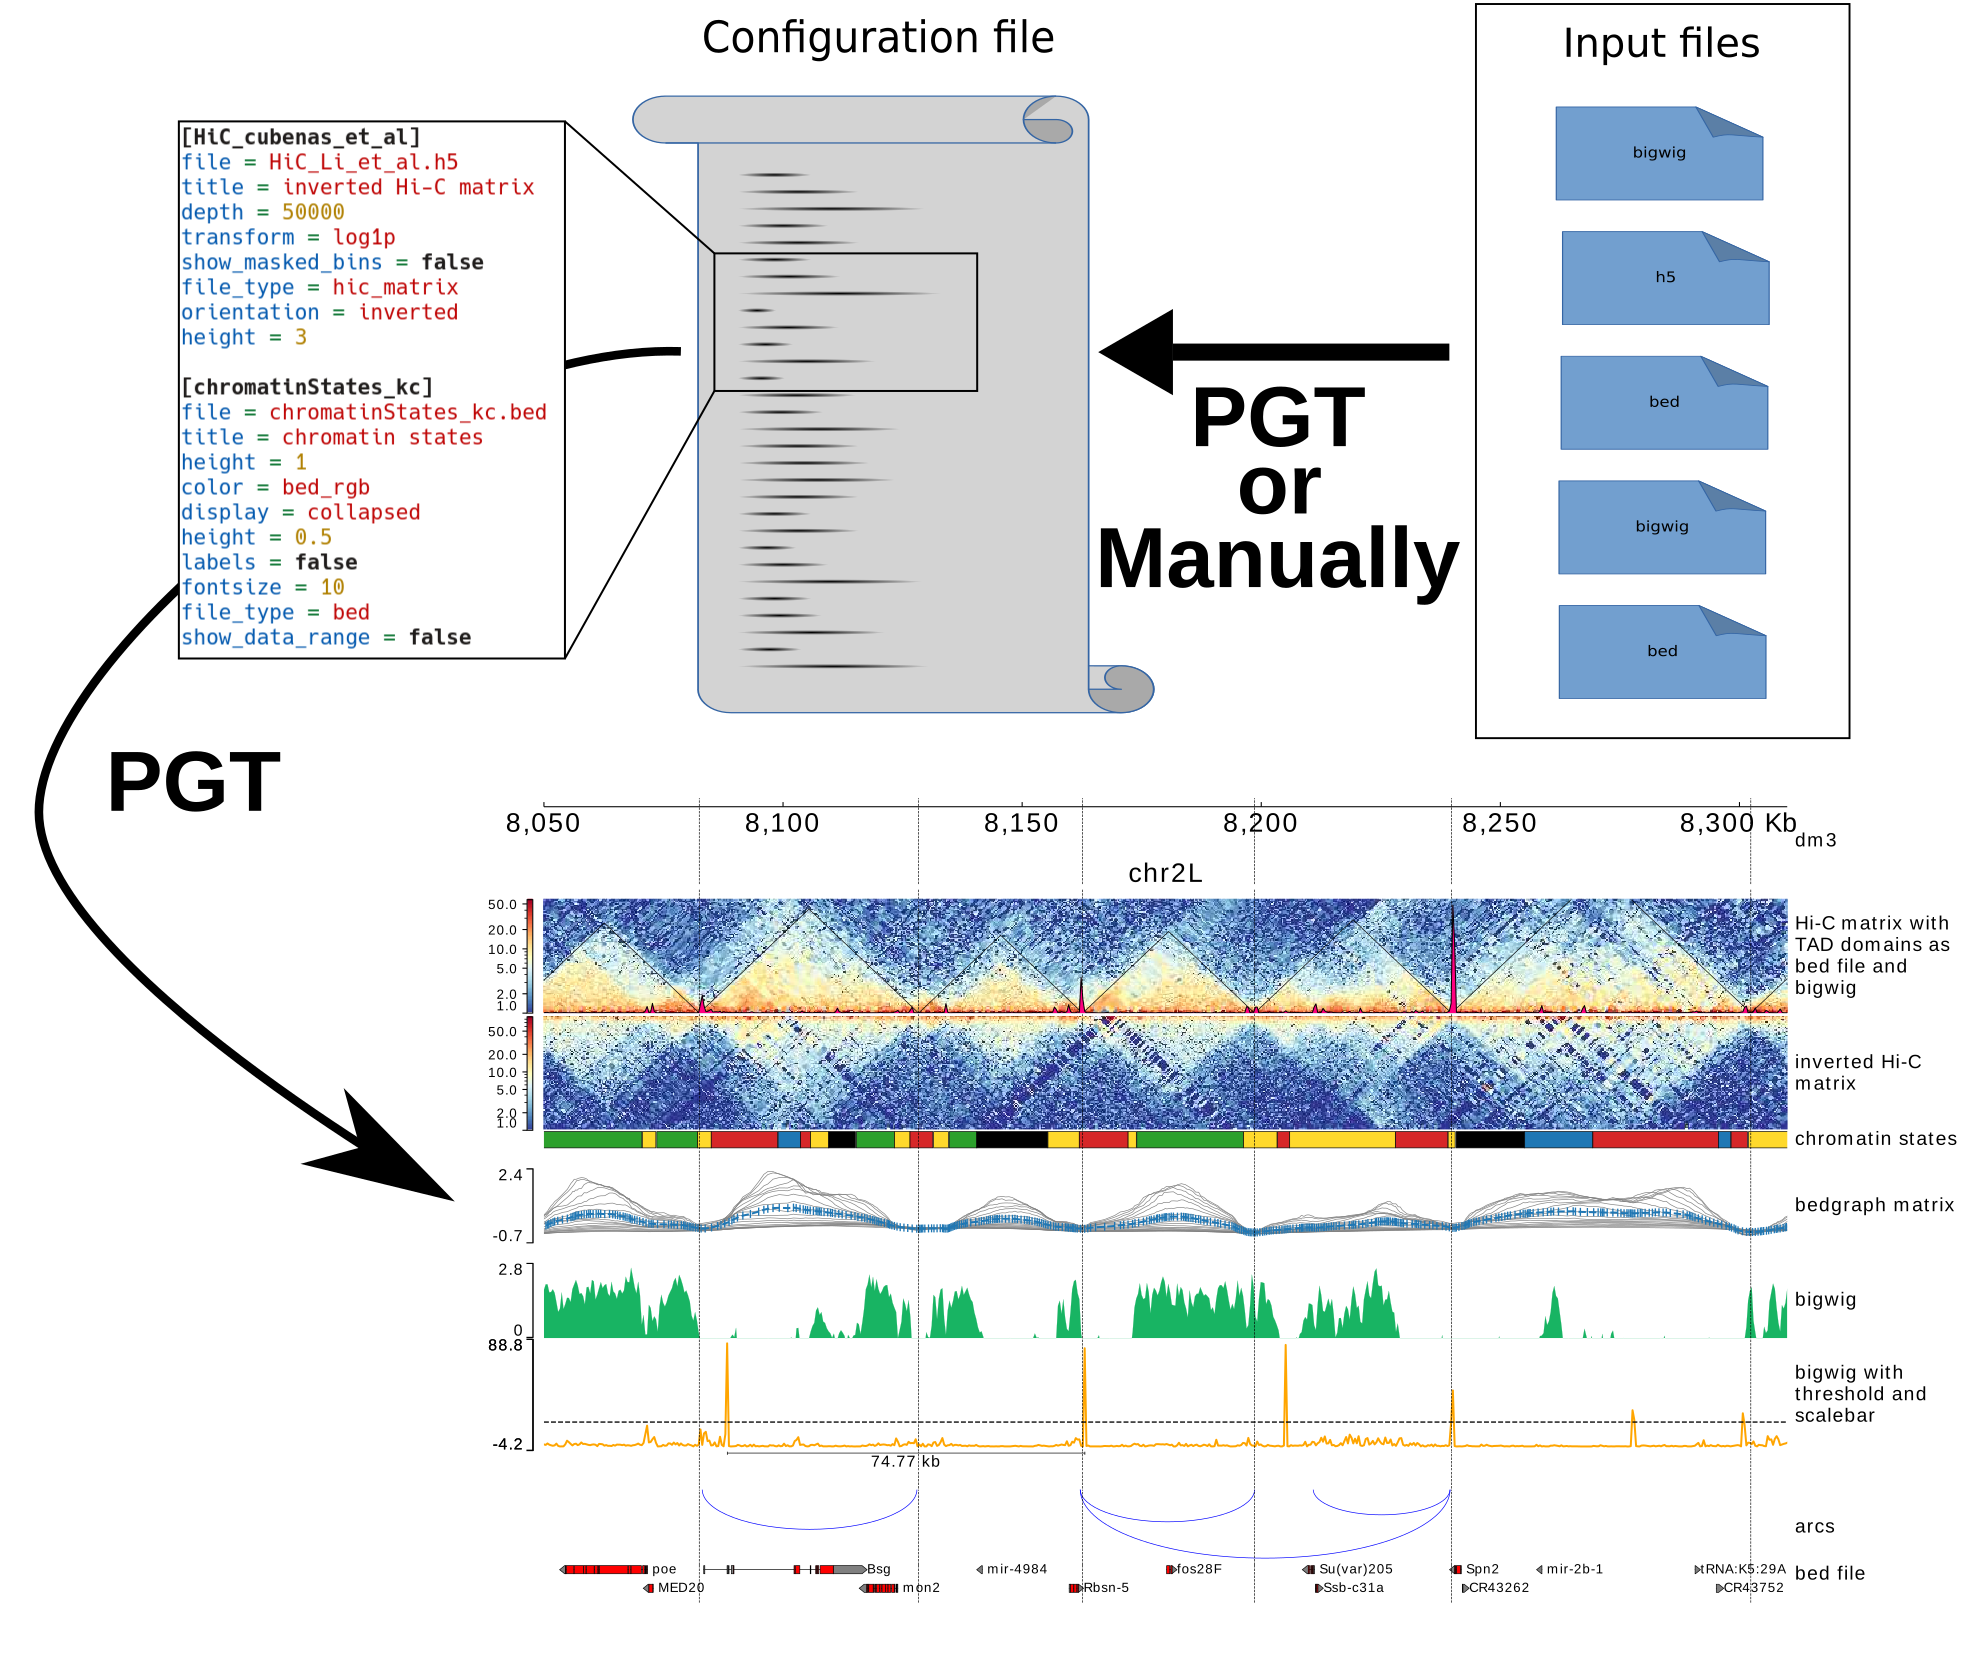
Here is a scheme which describe how pyGenomeTracks is working (graphical abstract of Lopez-Delisle et al. 2020):
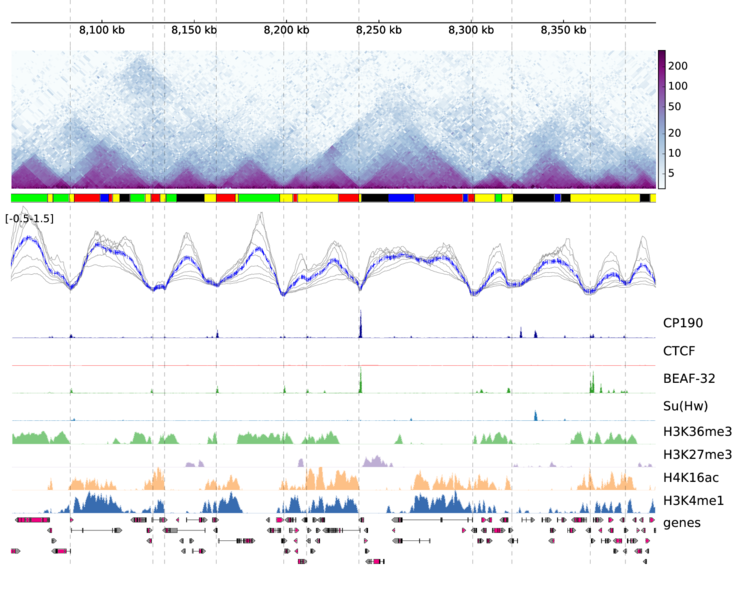
pyGenomeTracks can make plots with or without Hi-C data. The following is an example output of pyGenomeTracks from Ramírez et al. 2017.
There are 3 ways for using pyGenomeTracks:
Galaxy usage – the public European Galaxy server let’s you use pyGenomeTracks within the familiar Galaxy framework without the need to master the command line
command line usage – simply download and install the tool (see Installation and Usage)