Adding new tracks
Adding new tracks to pyGenomeTracks only requires adding a new class to the pygenometracks/tracks folder.
The name of the file must end with Track.py.
The class must inherit the GenomeTrack (or other track class available) and must have a plot method.
In order to work well with the config checker it should also have some global variable:
- DEFAULTS_PROPERTIES is a dictionary where each key is a parameter and each value is the default value when it is not set or when something goes wrong.
- NECESSARY_PROPERTIES is an array with all the parameters which are necessary for this track (usually ‘file’)
- SYNONYMOUS_PROPERTIES is a dictionary where each key is a parameter, each value is a dictionnary where each key is a string that should be replaced by the value (for example, SYNONYMOUS_PROPERTIES = {'max_value': {'auto': None}})
- POSSIBLE_PROPERTIES is a dictionary where each key is a parameter, each value is an array with the only possible values for this parameter, if the value specified by the user is not part of them, it will be substituted by the default value.
- BOOLEAN_PROPERTIES is an array with all parameters that should have a boolean value (a boolean value can be 0, 1, true, false, on, off)
- STRING_PROPERTIES is an array with all parameters that have string values. It should always contains title and file_type.
- FLOAT_PROPERTIES is a dictionnary where each key is a parameter, each value is an array with the min value (included) and the max value (included) that should have the parameter (You can use [- np.inf, np.inf] if there is no restriction). This dictionary should always contains 'height': [0, np.inf]
- INTEGER_PROPERTIES same as FLOAT_PROPERTIES for integer values.
Additionally, some basic description should be added.
For example, to make a track that prints ‘hello world’ at a given location looks like this:
# -*- coding: utf-8 -*-
from . GenomeTrack import GenomeTrack
import numpy as np


class TextTrack(GenomeTrack):
    SUPPORTED_ENDINGS = ['.txt']  # this is used by make_tracks_file to guess the type of track based on file name
    TRACK_TYPE = 'text'
    OPTIONS_TXT = """
height = 3
title =
text =
# x position of text in the plot (in bp)
x position =
"""
    DEFAULTS_PROPERTIES = {'text': 'hello world'}
    NECESSARY_PROPERTIES = ['x_position']
    SYNONYMOUS_PROPERTIES = {}
    POSSIBLE_PROPERTIES = {}
    BOOLEAN_PROPERTIES = []
    STRING_PROPERTIES = ['text', 'title', 'file_type']
    FLOAT_PROPERTIES = {'height': [0, np.inf],
                        'x_position': [0, np.inf]}
    INTEGER_PROPERTIES = {}

    def plot(self, ax, chrom, region_start, region_end):
        """
        This example simply plots the given title at a fixed
        location in the axis. The chrom, region_start and region_end
        variables are not used.
        Args:
            ax: matplotlib axis to plot
            chrom_region: chromosome name
            start_region: start coordinate of genomic position
            end_region: end coordinate
        """
        # print text at position x = self.properties['x position'] and y = 0.5 (center of the plot)
        ax.text(self.properties['x_position'], 0.5, self.properties['text'])
The OPTIONS_TXT should contain the text to build a default configuration file.
This information, together with the information about SUPPORTED_ENDINGS is used
by the program make_tracks_file to create a default configuration file
based on the endings of the files given.
The configuration file is:
[x-axis]
where = top

[new track]
file =
height = 4
title = new pyGenomeTrack
file_type = text
text = hello world
x position = 3100000
$ pyGenomeTracks --tracks new_track.ini --region X:3000000-3200000 -o new_track.png
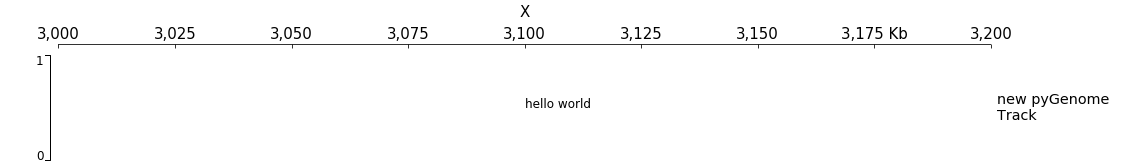
Notice that the resulting track already includes a y-axis (to the left) and
a label to the right. Those are the defaults that can be changed by
adding a plot_y_axis and plot_label methods.
Another more complex example is the plotting of multiple bedgraph data as matrices. The output of HiCExplorer hicFindTADs produces a file whose data format
is similar to a bedgraph but with more value columns. We call this a bedgraph matrix. The following track plot this bedgraph matrix:
# -*- coding: utf-8 -*-
import numpy as np
from . BedGraphTrack import BedGraphTrack
from . GenomeTrack import GenomeTrack


class BedGraphMatrixTrack(BedGraphTrack):
    # this track class extends a BedGraphTrack that is already part of
    # pyGenomeTracks. The advantage of extending this class is that
    # we can re-use the code for reading a bedgraph file
    SUPPORTED_ENDINGS = ['.bm', '.bm.gz']
    TRACK_TYPE = 'bedgraph_matrix'
    OPTIONS_TXT = GenomeTrack.OPTIONS_TXT + f"""
# a bedgraph matrix file is like a bedgraph, except that per bin there
# are more than one value (separated by tab). This file type is
# produced by the HiCExplorer tool hicFindTads and contains
# the TAD-separation score at different window sizes.
# E.g.
# chrX	18279	40131	0.399113	0.364118	0.320857	0.274307
# chrX	40132	54262	0.479340	0.425471	0.366541	0.324736
#min_value = 0.10
#max_value = 0.70
file_type = {TRACK_TYPE}
"""
    DEFAULTS_PROPERTIES = {'max_value': None,
                           'min_value': None,
                           'show_data_range': True,
                           'orientation': None}
    NECESSARY_PROPERTIES = ['file']
    SYNONYMOUS_PROPERTIES = {'max_value': {'auto': None},
                             'min_value': {'auto': None}}
    POSSIBLE_PROPERTIES = {'orientation': [None, 'inverted']}
    BOOLEAN_PROPERTIES = ['show_data_range']
    STRING_PROPERTIES = ['file', 'file_type', 'overlay_previous',
                         'orientation', 'title']
    FLOAT_PROPERTIES = {'max_value': [- np.inf, np.inf],
                        'min_value': [- np.inf, np.inf],
                        'height': [0, np.inf]}
    INTEGER_PROPERTIES = {}

    # In BedGraphTrack the method set_properties_defaults
    # has been adapted to a coverage track. Here we want to
    # go back to the initial method:
    def set_properties_defaults(self):
        GenomeTrack.set_properties_defaults(self)

    def plot(self, ax, chrom_region, start_region, end_region):
        """
        Args:
            ax: matplotlib axis to plot
            chrom_region: chromosome name
            start_region: start coordinate of genomic position
            end_region: end coordinate
        """
        start_pos = []
        matrix_rows = []

        # the BedGraphTrack already has methods to read files
        # in which the first three columns are chrom, start,end
        # here we used the interval_tree method inherited from the
        # BedGraphTrack class
        for region in sorted(self.interval_tree[chrom_region][start_region - 10000:end_region + 10000]):
            start_pos.append(region.begin)
            # the region.data contains all the values for a given region
            # In the following code, such list is converted to floats and
            # appended to a new list.
            values = list(map(float, region.data))
            matrix_rows.append(values)

        # using numpy, the list of values per line in the bedgraph file
        # is converted into a matrix whose columns contain
        # the bedgraph values for the same line (notice that
        # the matrix is transposed to achieve this)
        matrix = np.vstack(matrix_rows).T

        # using meshgrid we get x and y positions to plot the matrix at
        # corresponding positions given in the bedgraph file.
        x, y = np.meshgrid(start_pos, np.arange(matrix.shape[0]))

        # shading adds some smoothing to the pllot
        shading = 'gouraud'
        vmax = self.properties['max_value']
        vmin = self.properties['min_value']

        img = ax.pcolormesh(x, y, matrix, vmin=vmin, vmax=vmax, shading=shading)
        img.set_rasterized(True)

    def plot_y_axis(self, ax, plot_axis):
        """turn off y_axis plot"""
        pass

    def __del__(self):
        if self.tbx is not None:
            self.tbx.close()
Let’s create a track for this:
[bedgraph matrix]
file = tad_separation_score.bm.gz
file_type = bedgraph_matrix
title = bedgraph matrix
height = 5

[spacer]

[x-axis]
$ pyGenomeTracks --tracks bedgraph_matrix.ini --region X:2000000-3500000 -o bedgraph_matrix.png
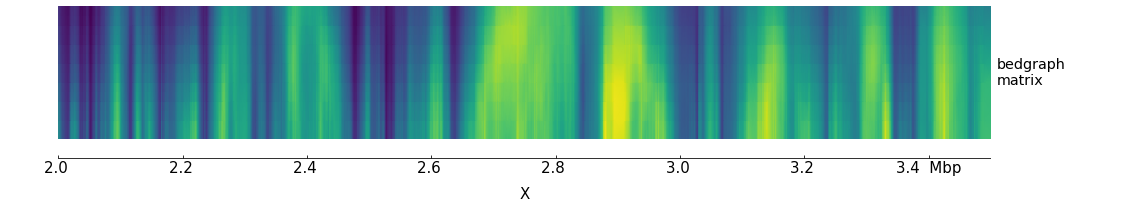
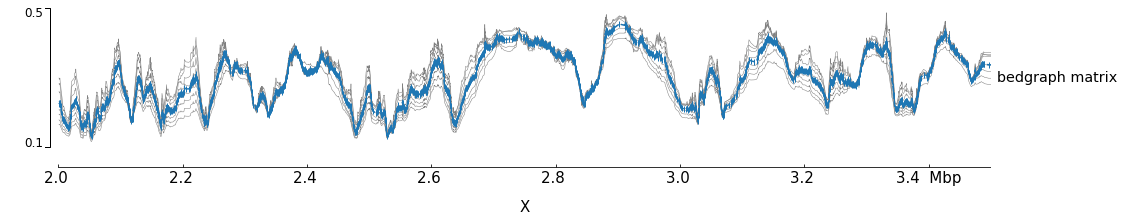
Although this image looks interesting another way to plot
the data is a overlapping lines with the mean value highlighted.
Using the bedgraph version of pyGenomeTracks the following image
can be obtained: